Graphy
Giving a charting tool its very first visual identity.
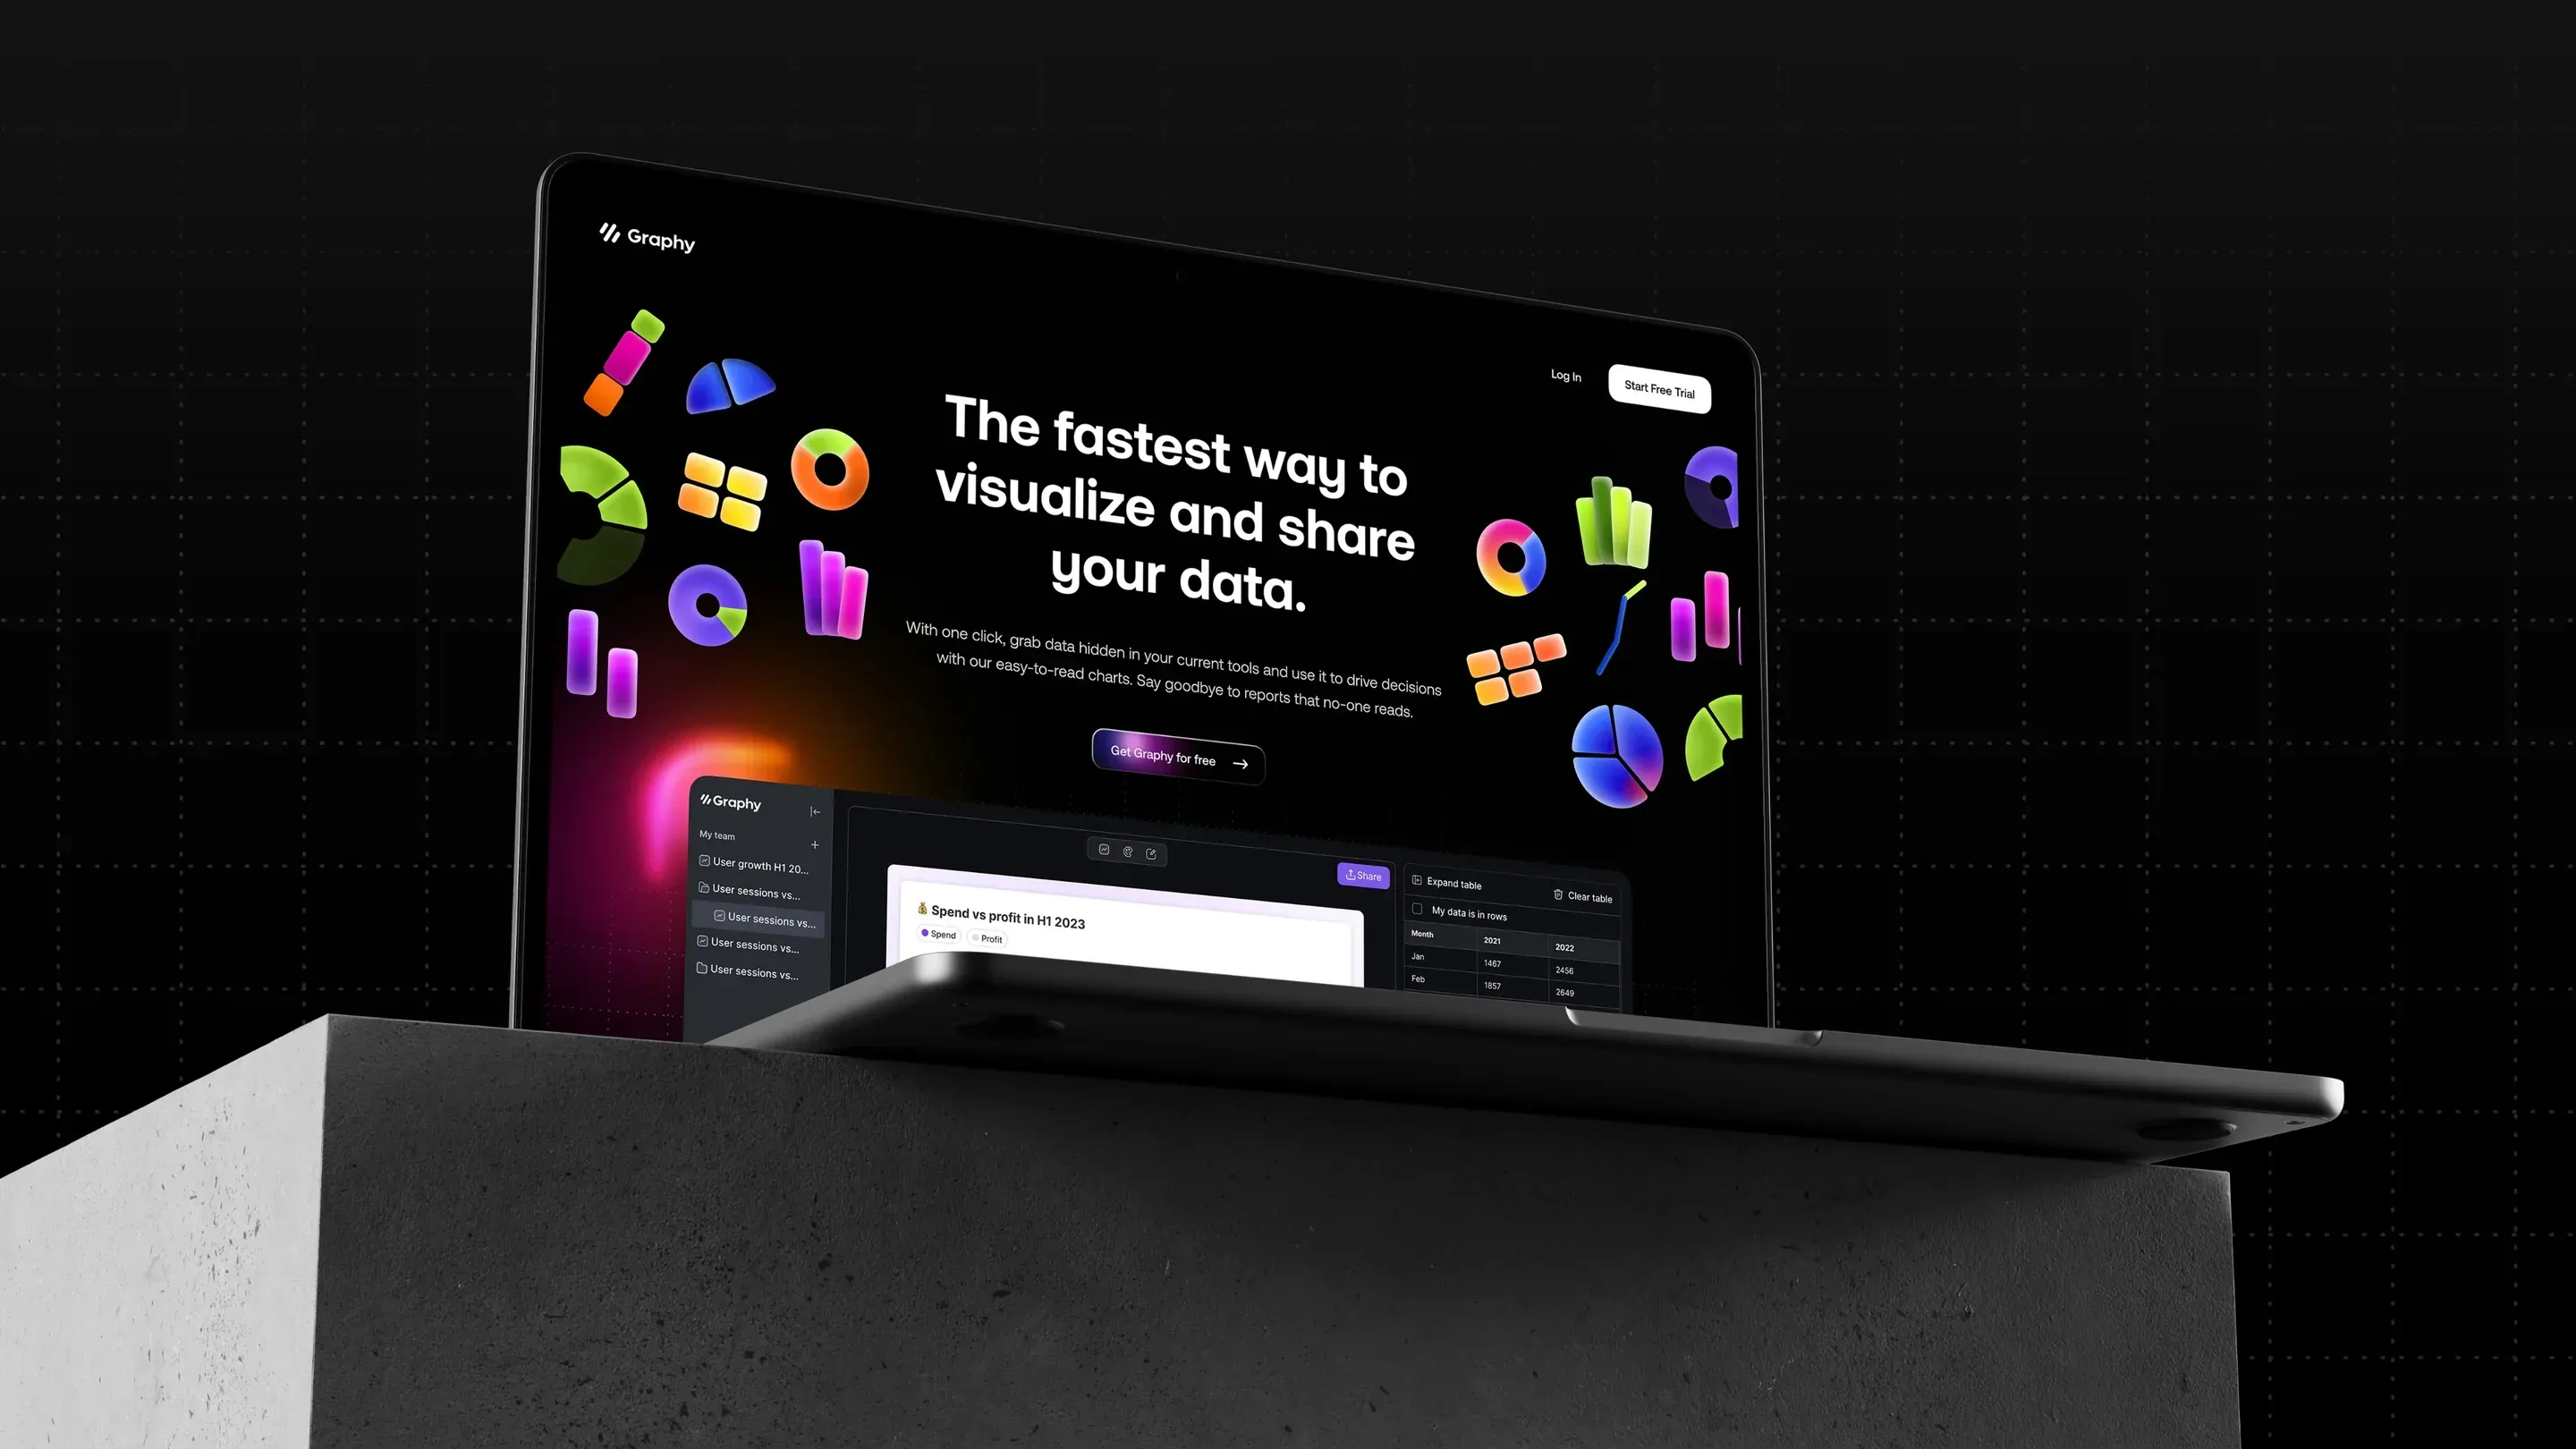
In 2023, Graphy already had a product that saves people hours: a tool that turns a spreadsheet into charts and dashboards ready to share. What it lacked was an image to match. Hervé created its very first visual identity, and the website to carry it.
Nobody reads a spreadsheet
Making data desirable, for everyone
Graphy starts from a simple idea: a number is useless if nobody understands it. The tool takes in any dataset, surfaces what matters and turns it into interactive charts and dashboards, ready to drop into a deck, a doc or a post.
To keep growing, the startup had to speak to a far broader professional audience than analysts alone: finance, marketing, leadership. The brand had to strike the right balance, approachable without being a gimmick, credible without being austere.

A hundred ways to draw a chart
The product as raw material
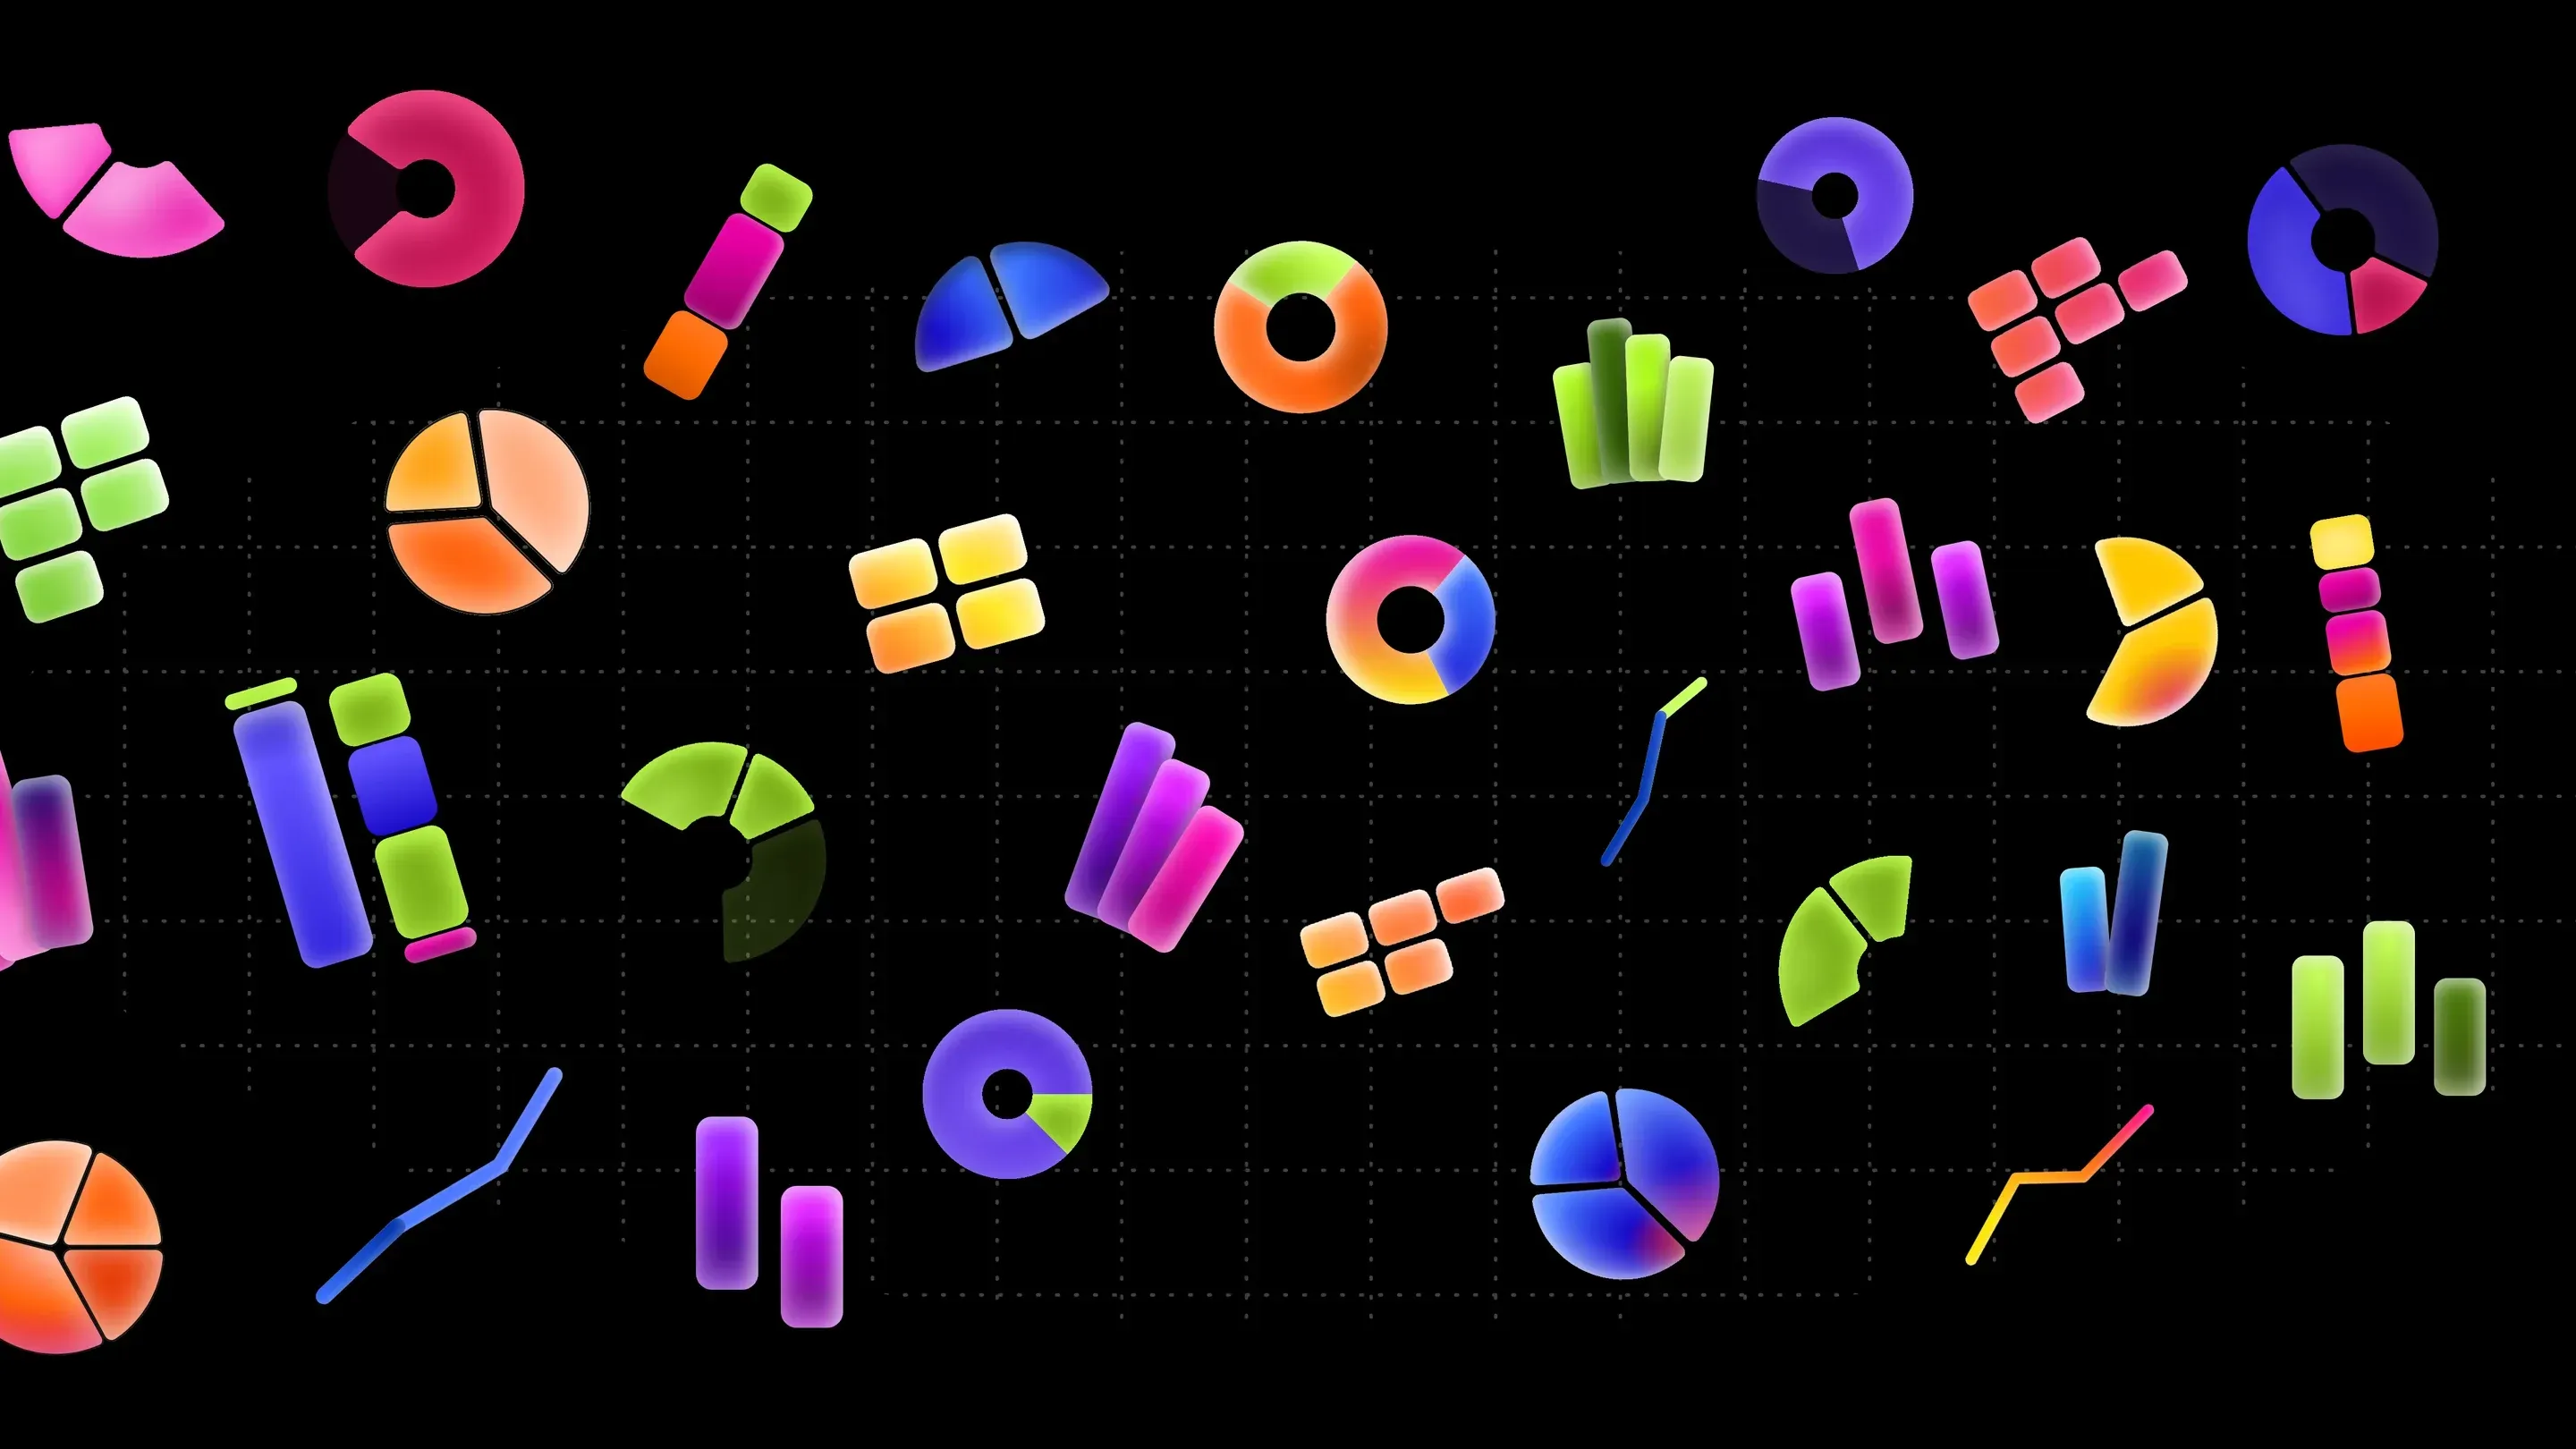
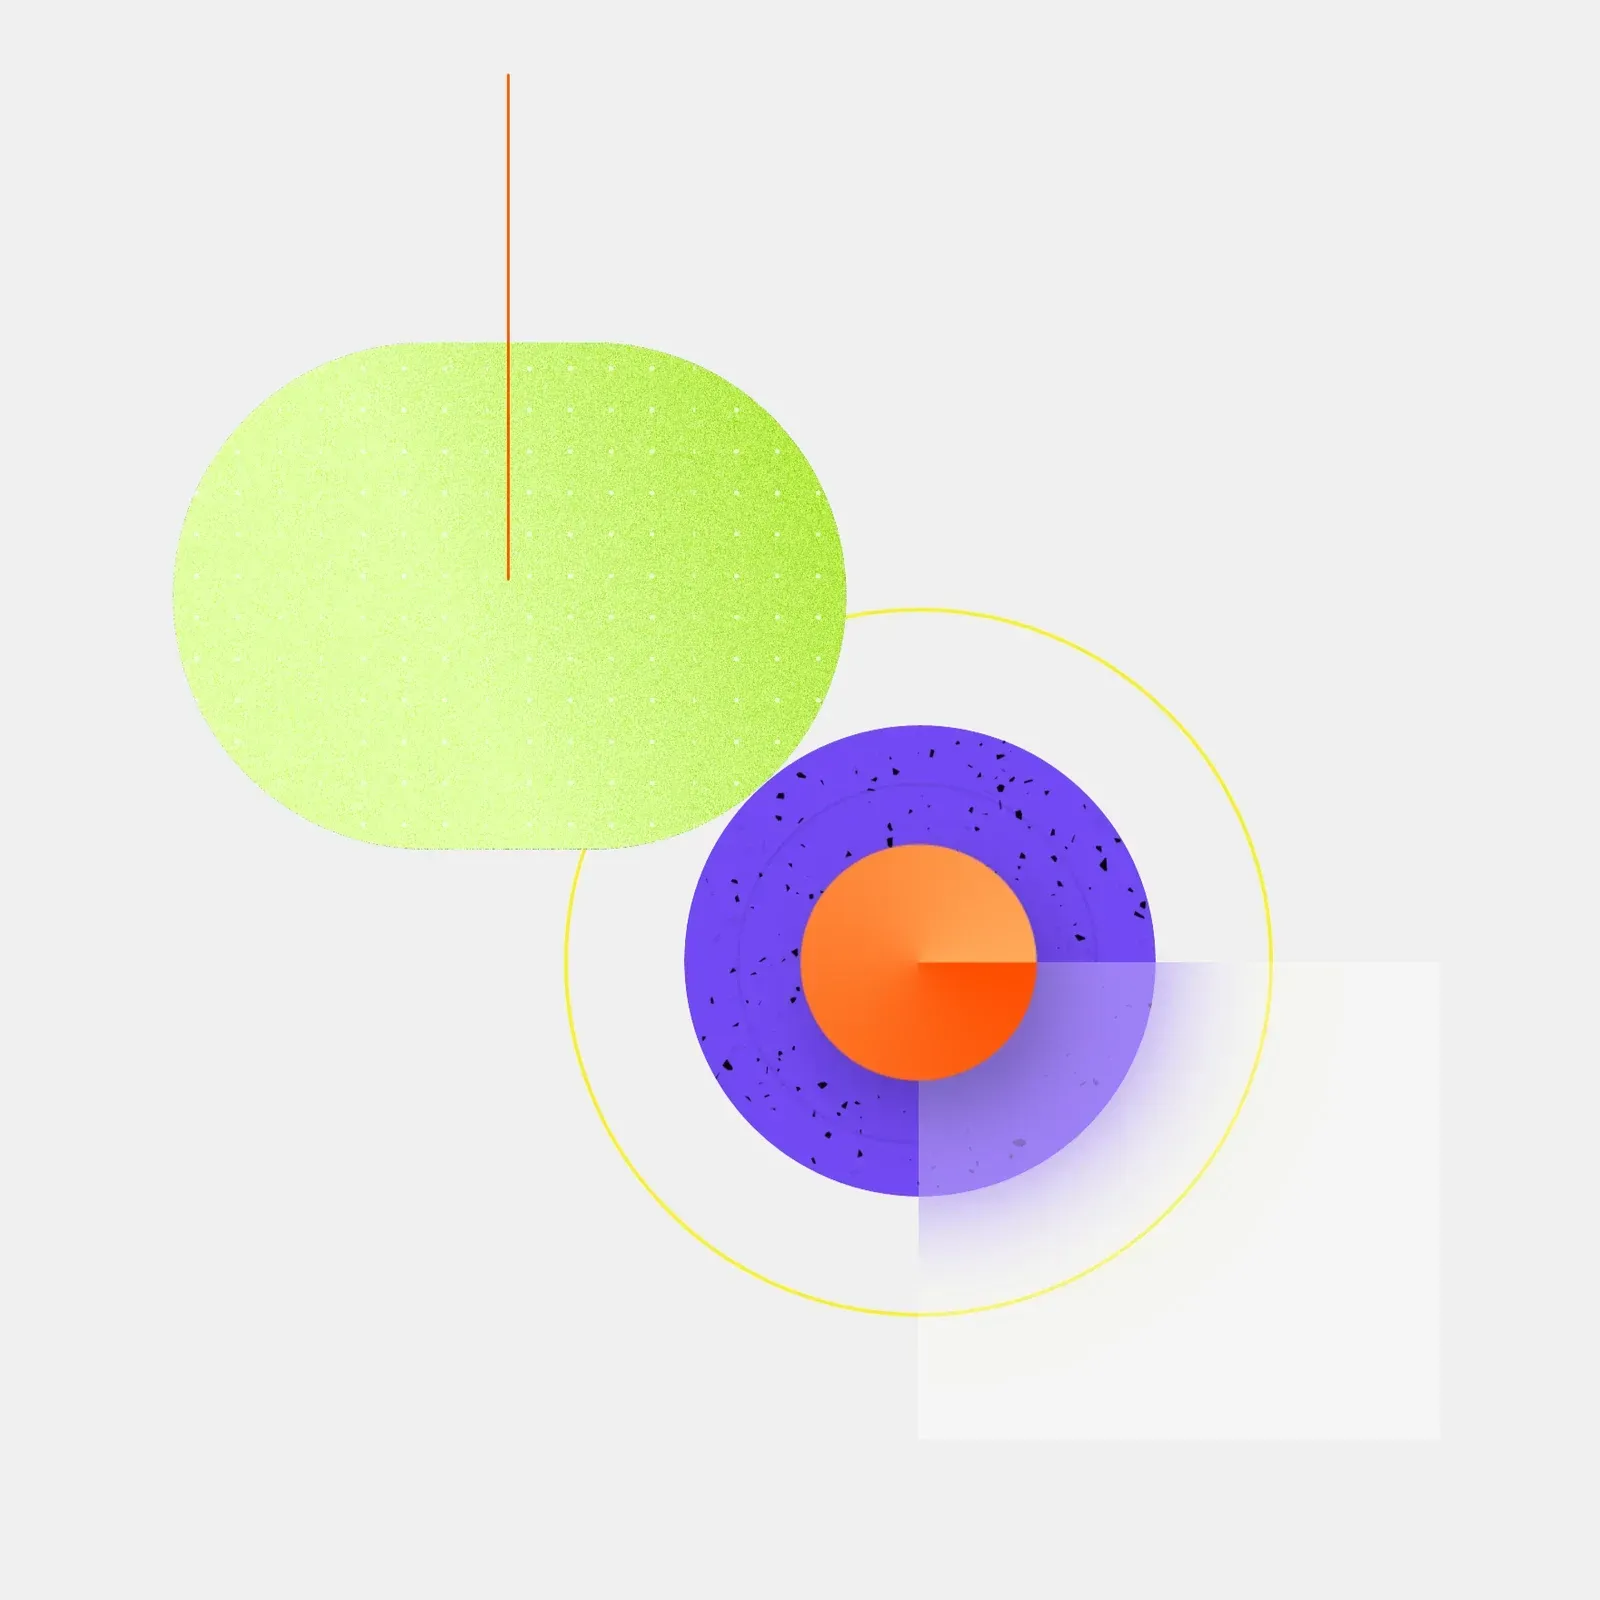
Rather than inventing symbols, we built the brand’s world out of what Graphy makes: charts. Bars, pies, lines and donuts became our playground.
We explored three directions: clean abstract shapes, illustrations closer to the interface, and 3D experiments.
Yummy candy charts
Playful and rigorous at once
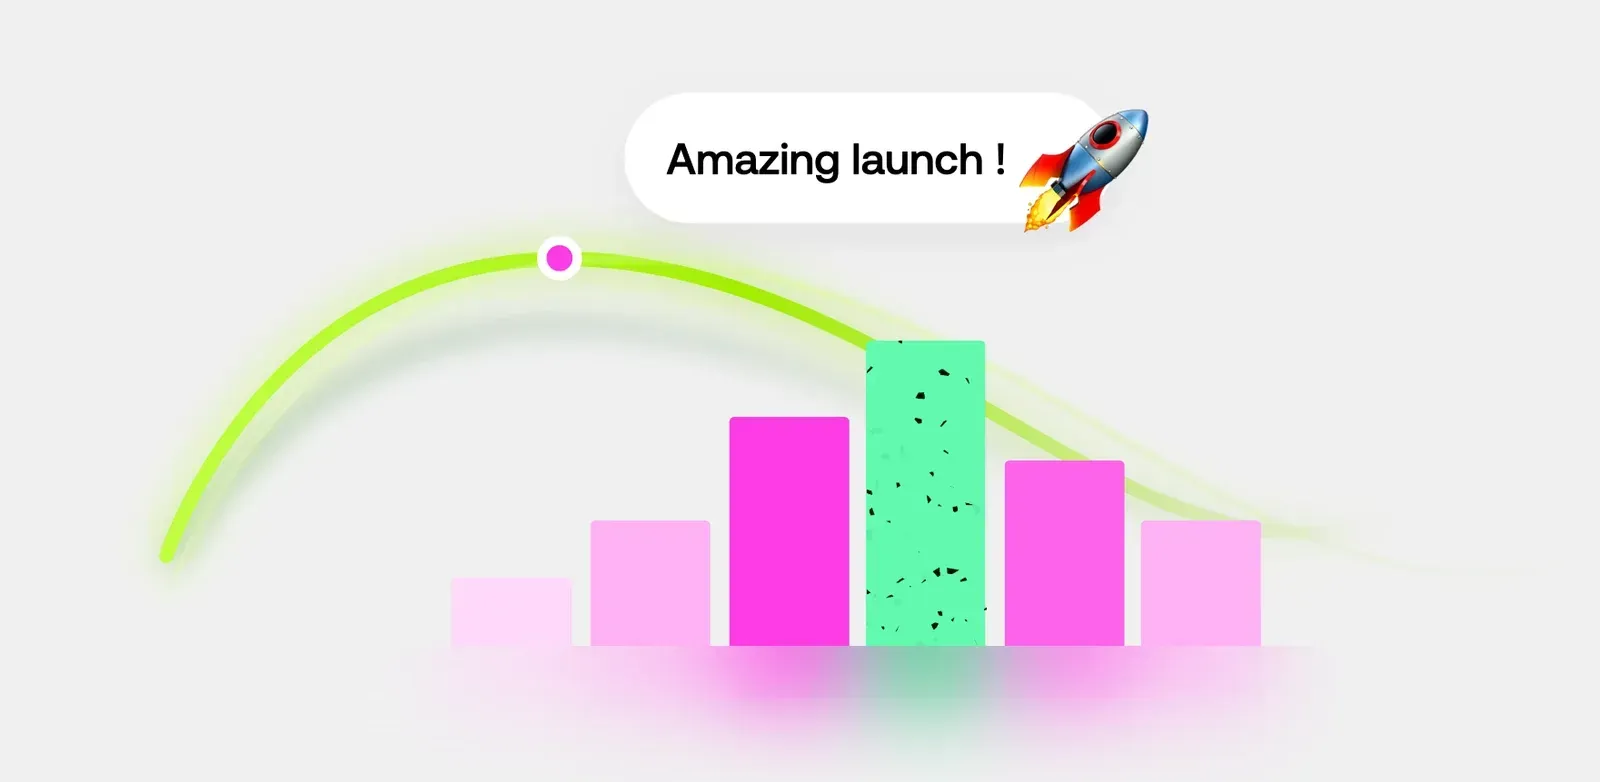
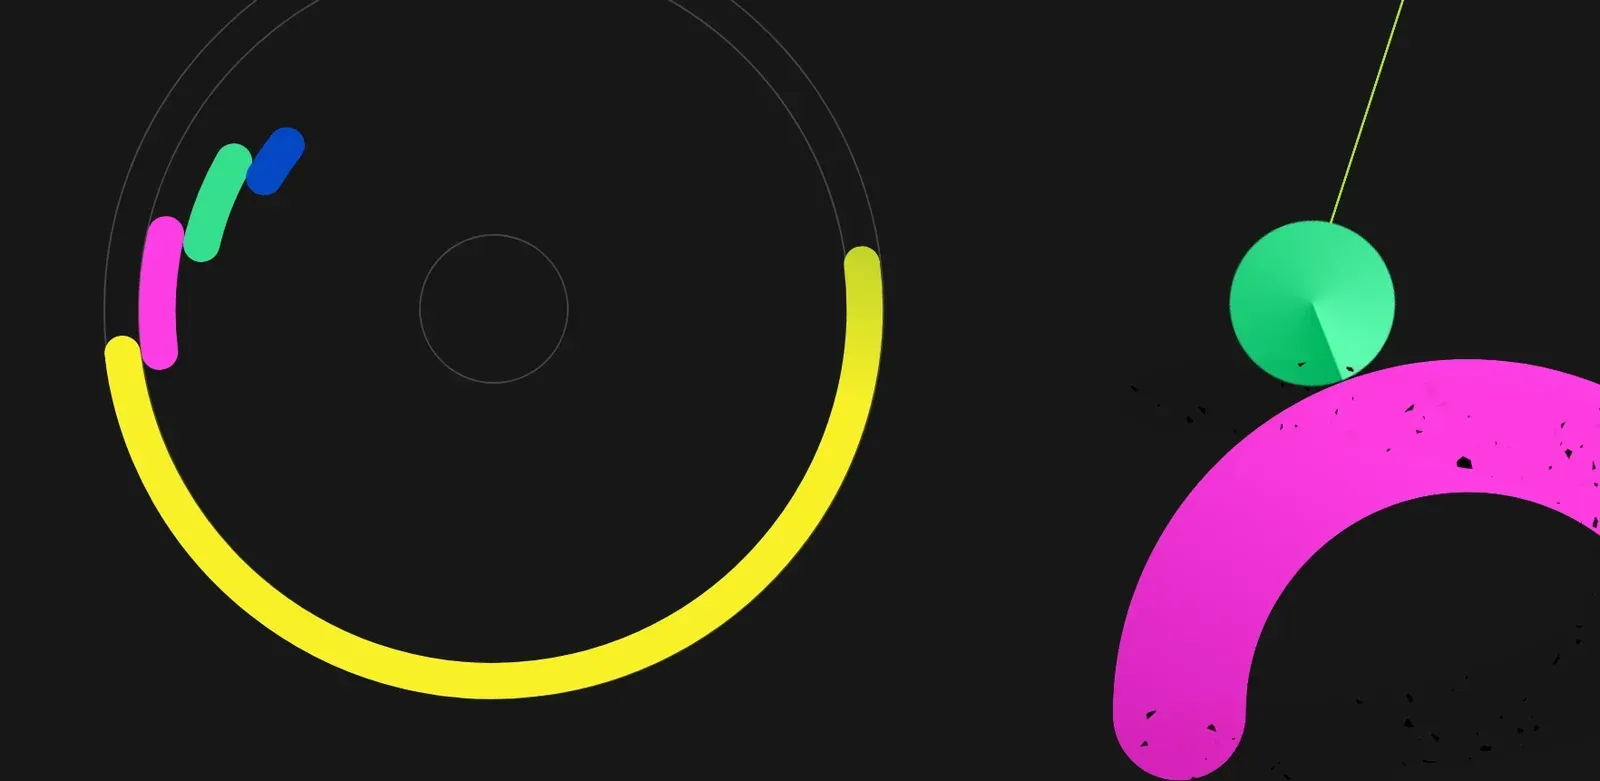
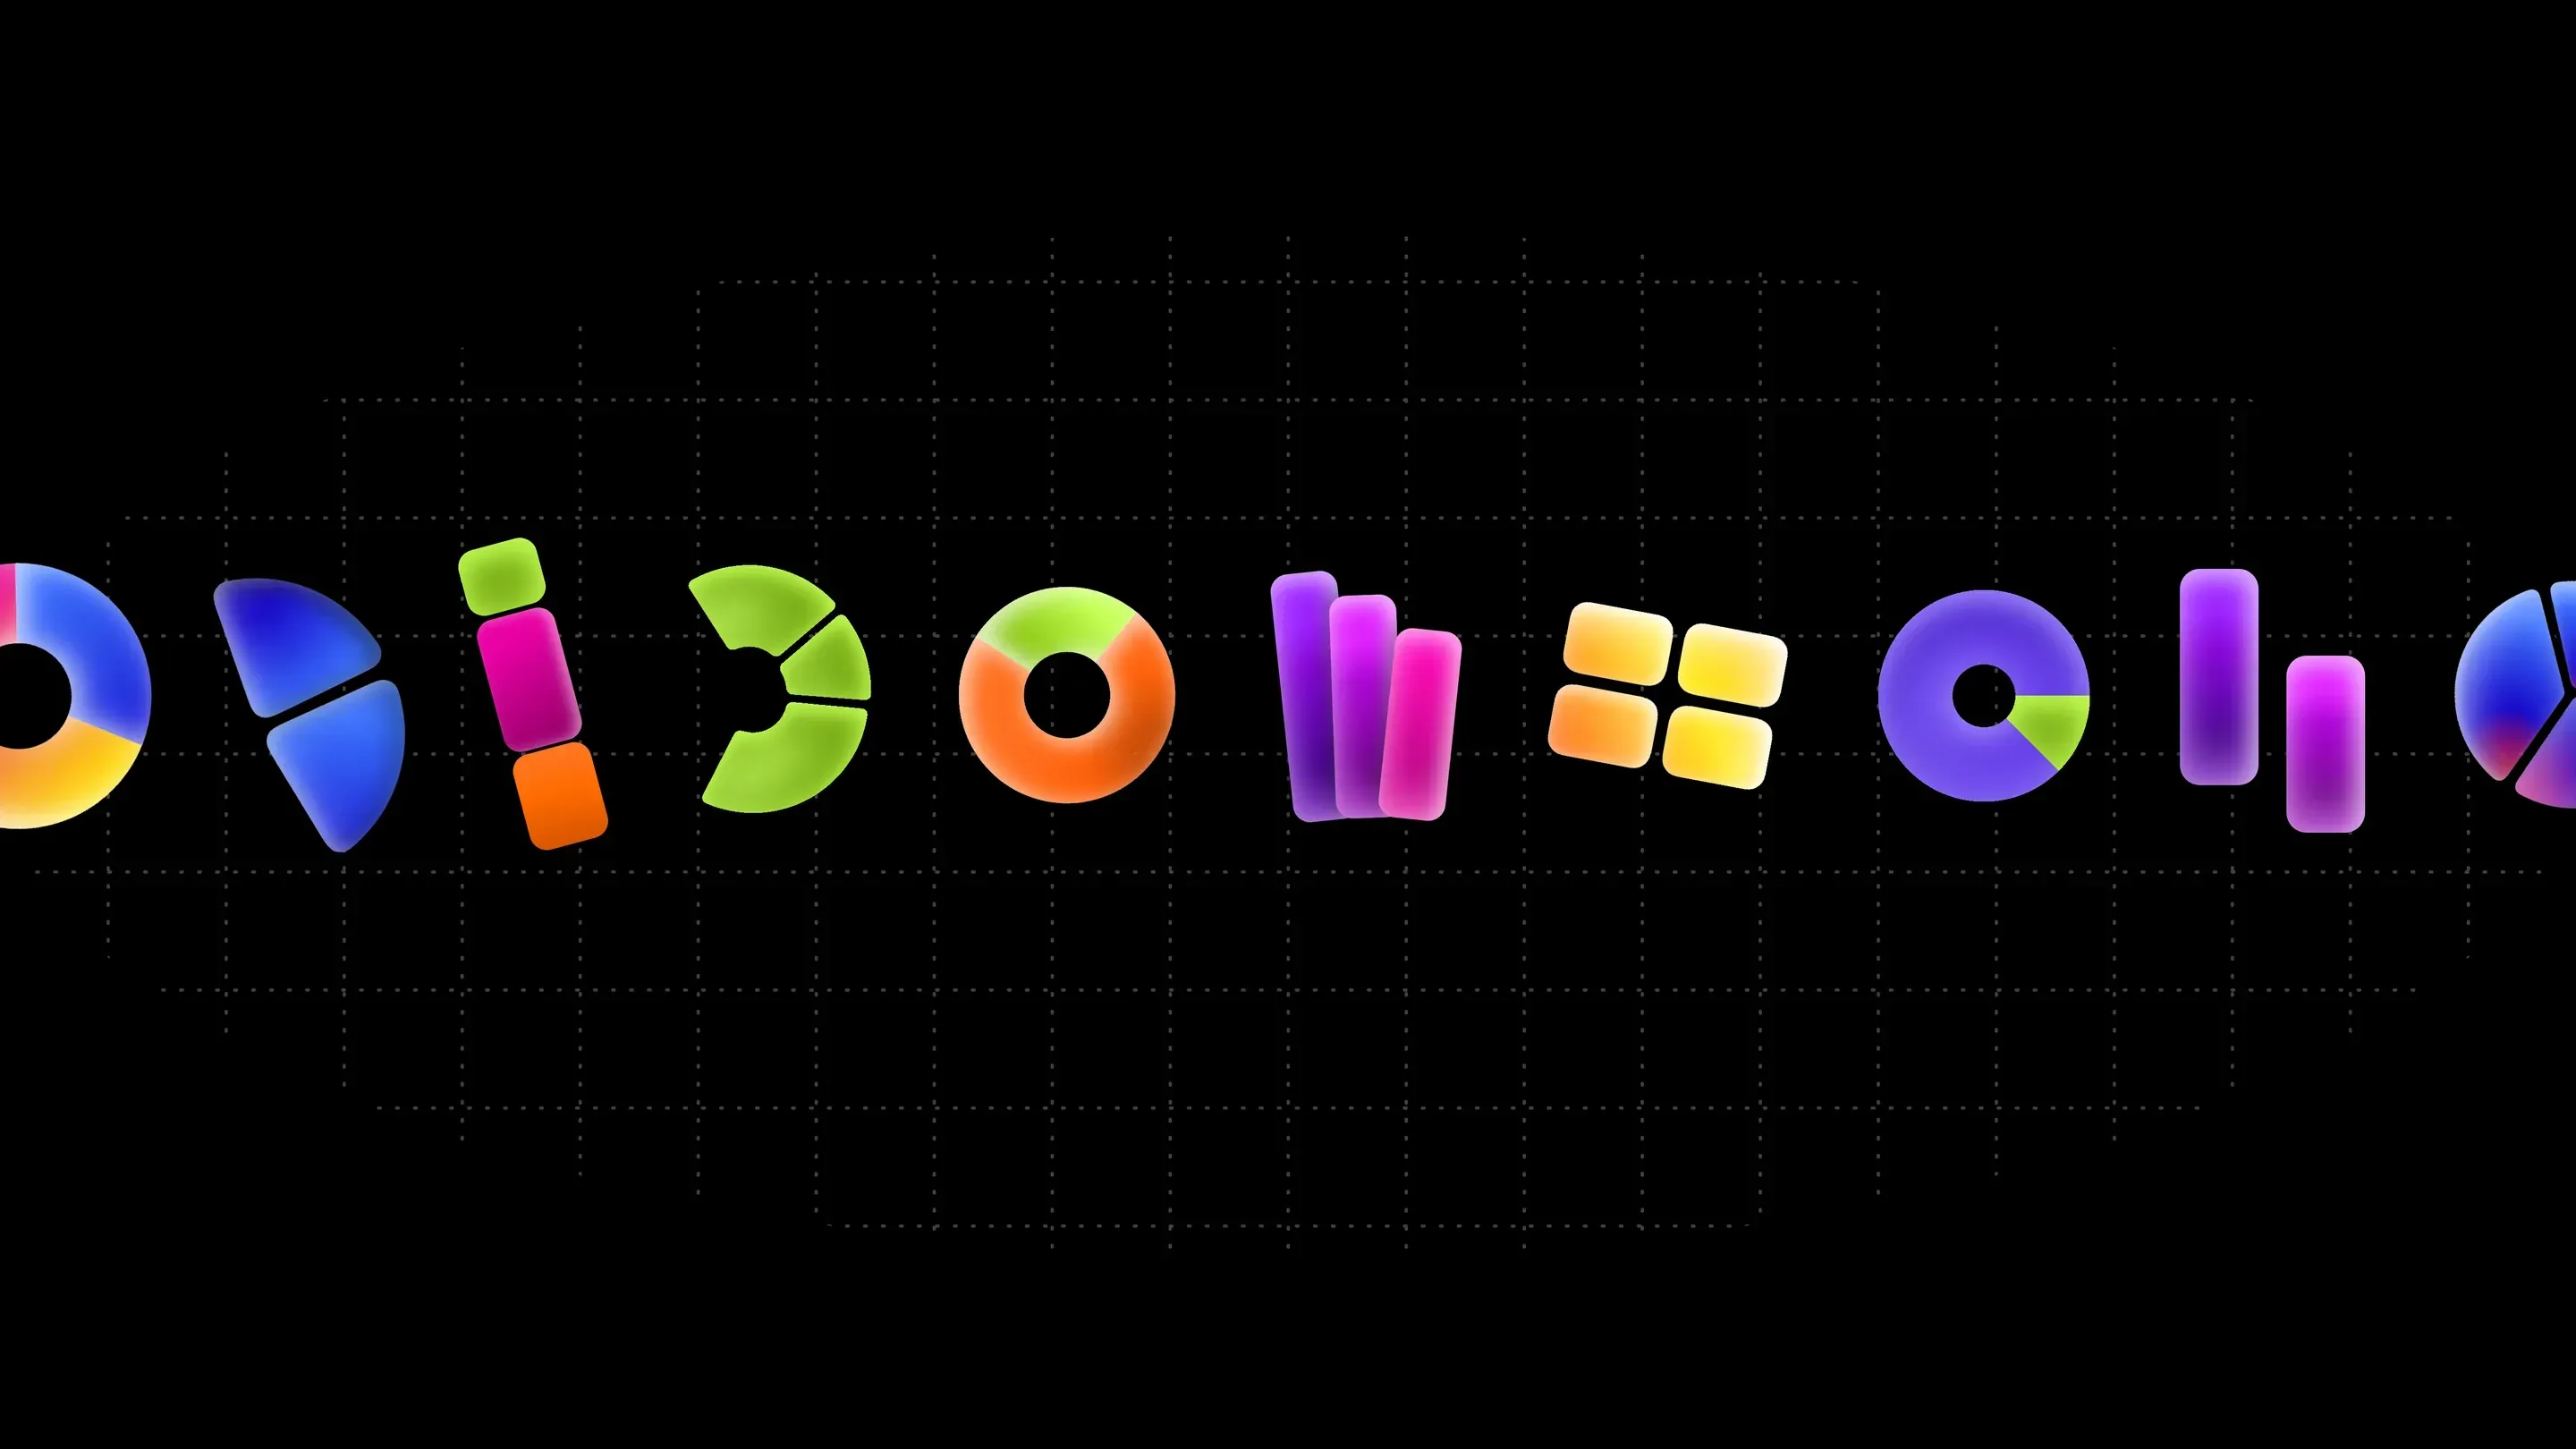
Graphy takes minutes to learn, and the brand had to make that felt at first glance. The charts became candy: glossy, colourful, almost edible. They speak to how simple and enjoyable the tool is to use.
Set on a fine grid against a dark background, they keep the rigour of data. That balance between play and precision is what lets Graphy win over a broad audience without losing credibility.
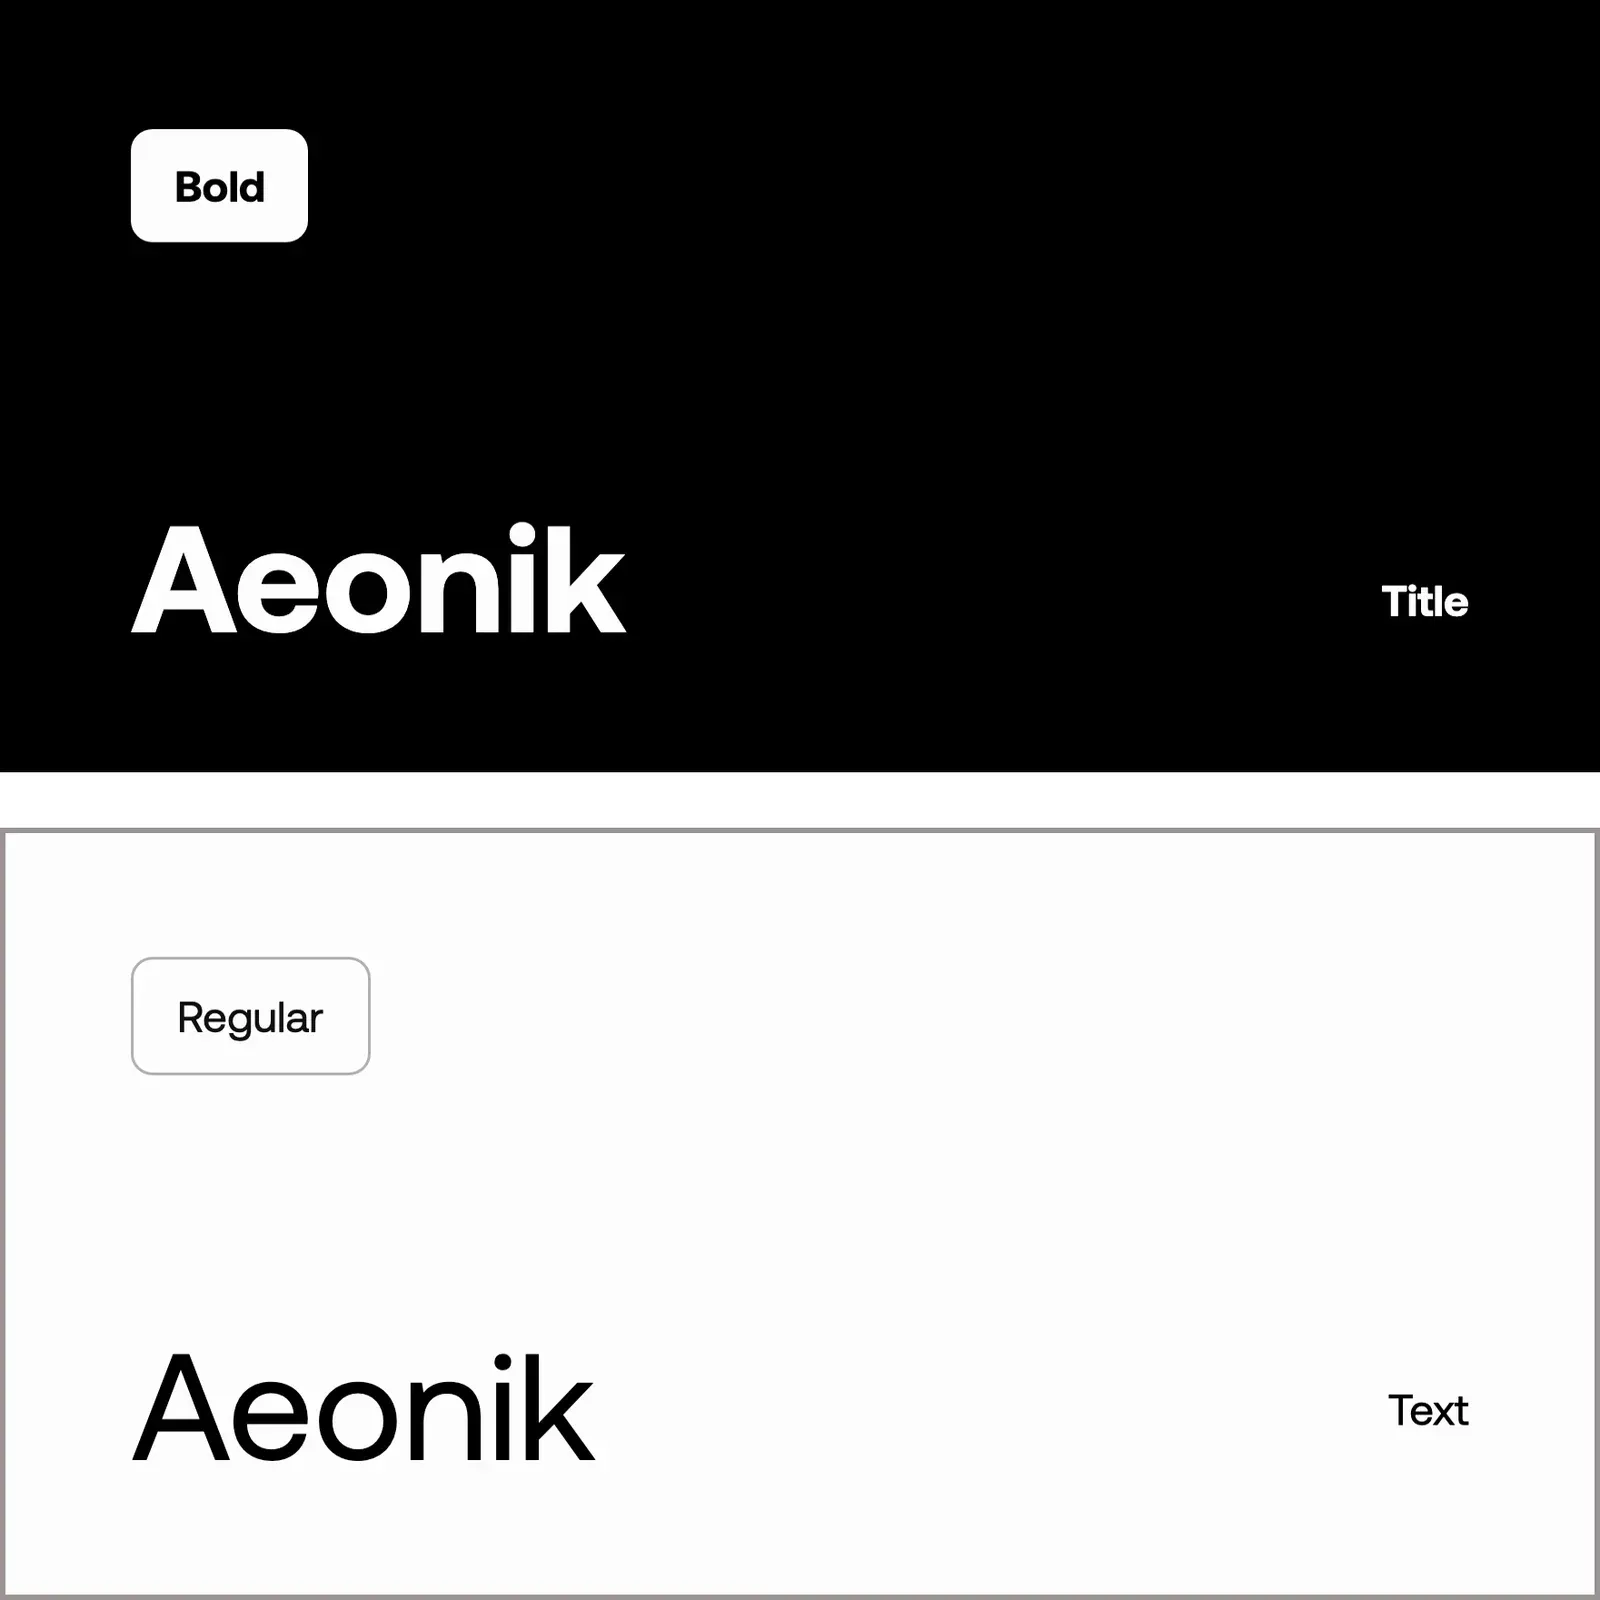
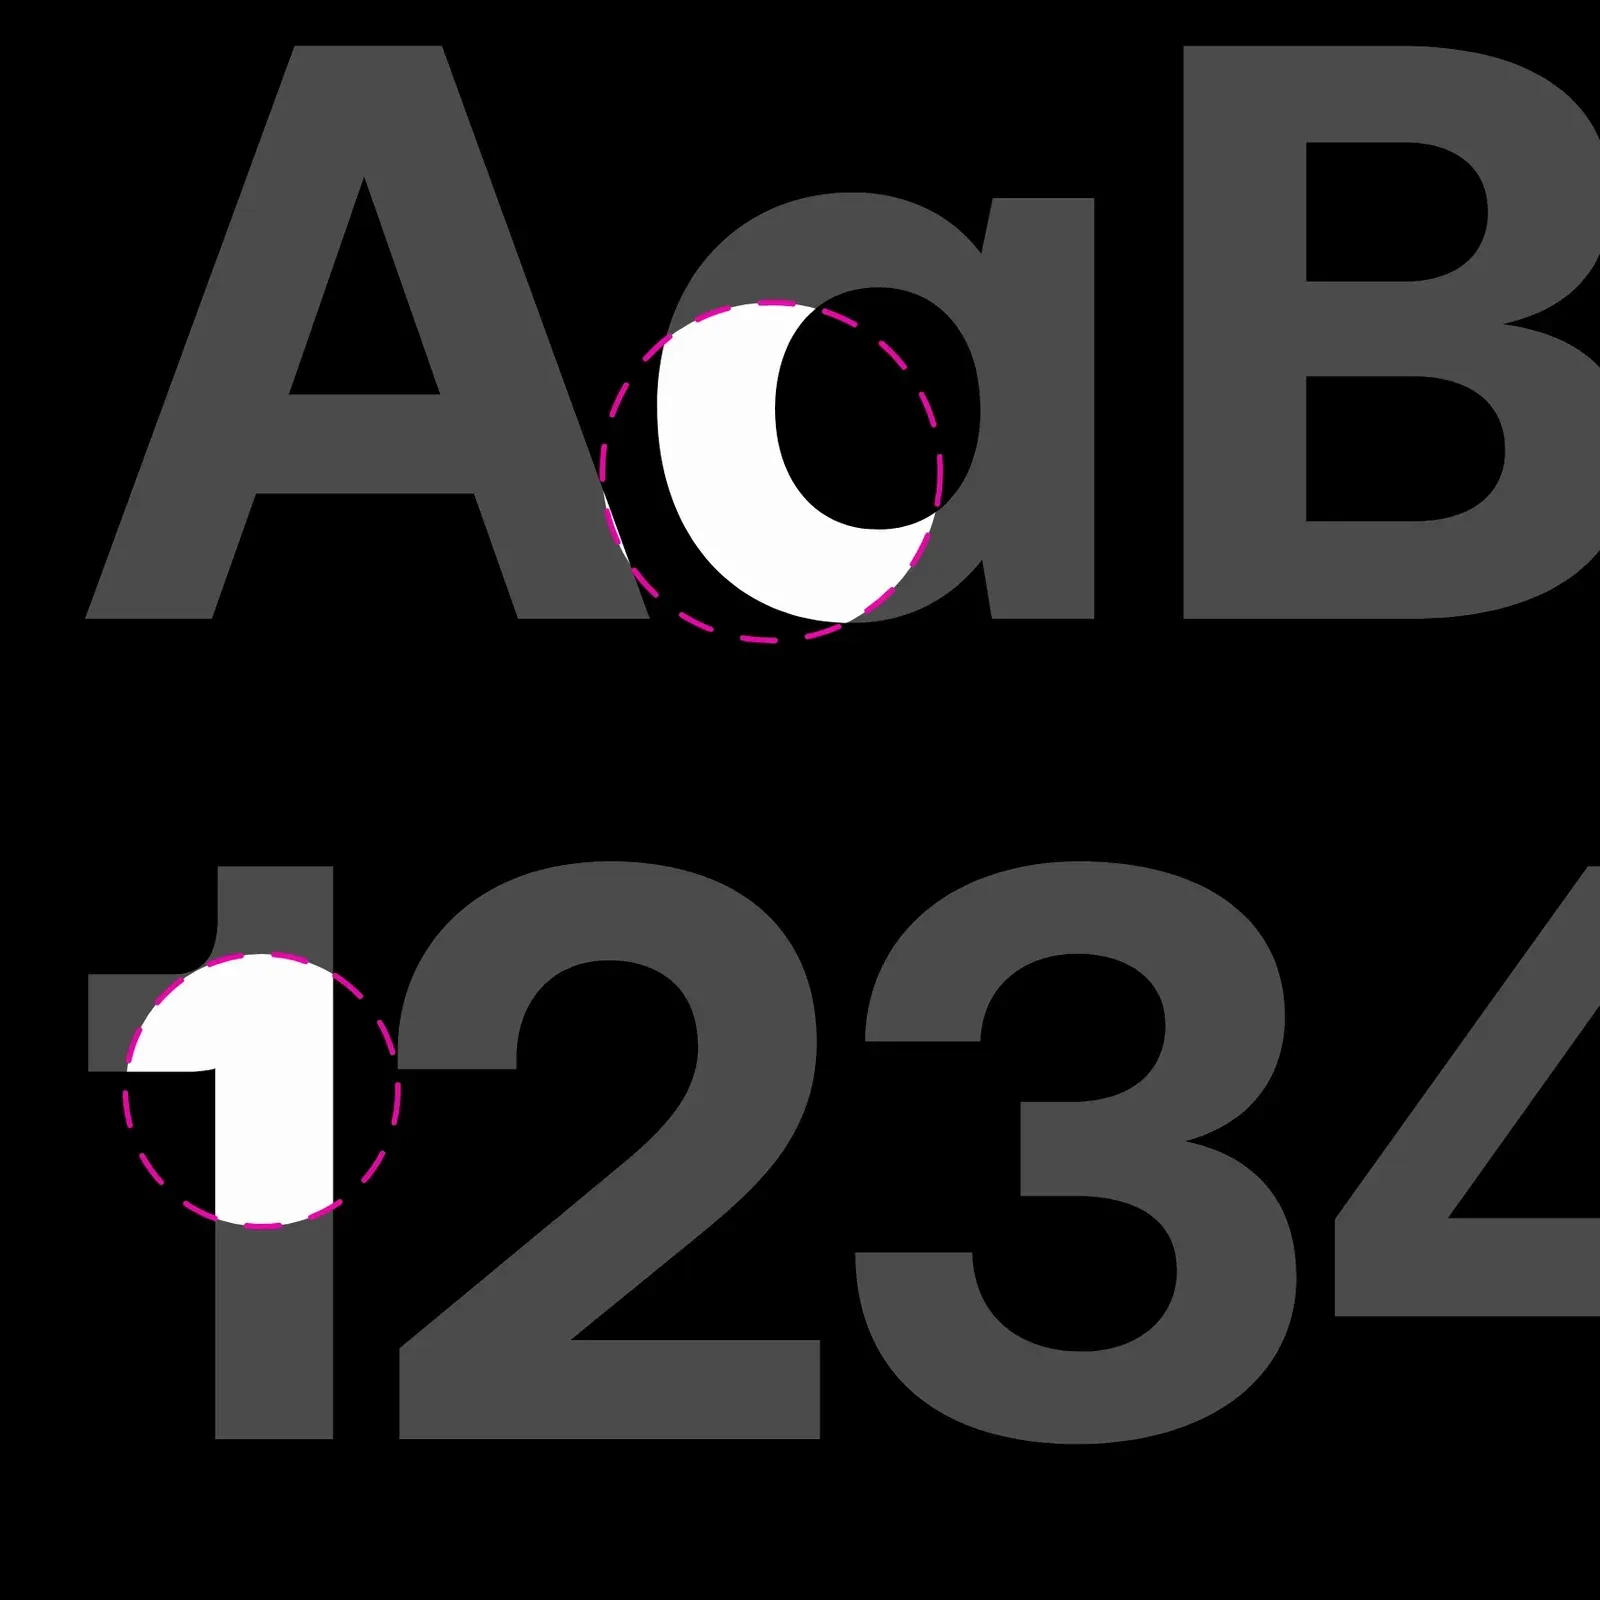
The typography follows the same principle: Aeonik, Bold for headlines and Regular for text. A clean grotesque, precise without feeling cold, that leaves the spotlight to the charts.
Charts in motion
Showing the product instead of describing it
On the website, every section comes alive to show the tool at work: candy charts making their entrance as the page opens, then the Chrome extension pulling data from Mixpanel, Amplitude or Google Sheets and turning it into charts ready to share.
The same idea drives the product film we made for Graphy: a question asked in plain language, data falling into place, a chart appearing. Graphy’s whole promise in under thirty seconds.